IBM announced their hybrid operational analytics solution on Sep 2021 which merged two products ZLDA and ZCDP into Z Operational Log and Data Analytics (ZOLDA). According to IBM:
…near real-time IBM Z® operational data is streamed to an enterprise analytics platform, or the included log analysis platform, or both.
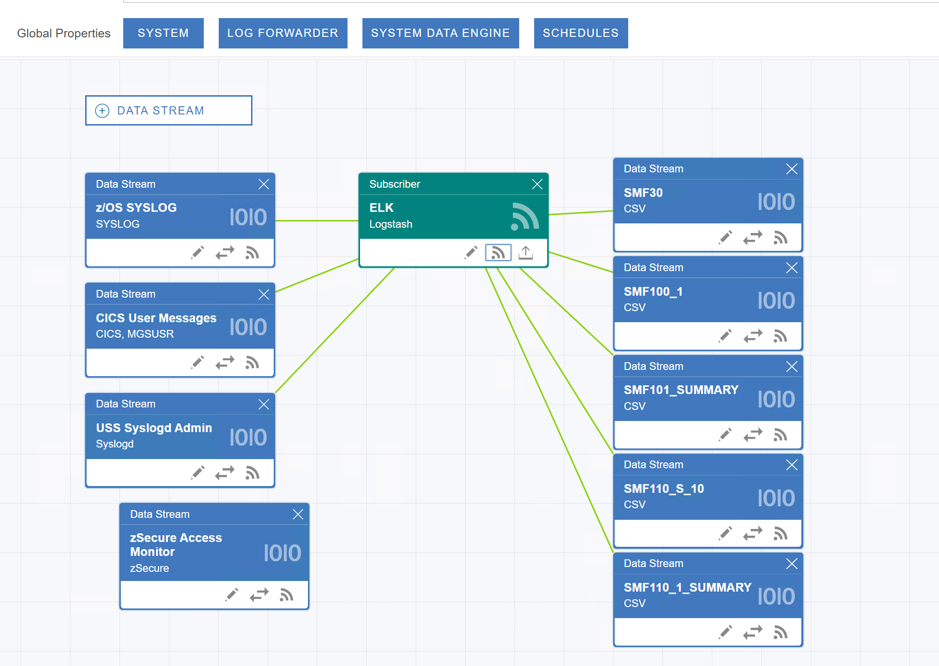
The true beauty of this software is enabling data analytic solutions on distributed platform like ELK or Splunk to ingest Mainframe ops data and logs. Almost all mainframe ops data captured by SMF and logging can be streamed by ZOLDA and piped to data analytic engine outside platform z, like:
- RMF (70-79), SMF30, CICS (110-112), DB2(101-102)
- MVS SYSLOG/OPERLOG
- USS log(syslogd)
- CICS MSGUSR
- STC log or batch log
Mainframe being one of the most well established computing platform has dominated commercial computing for decades, it has the capability to ‘log everything’, every system/application event, every DB query, every minor state change of a service, are either logged as plain text or recoded by System management facilities (SMF) as MF-readable only data. To read data collected by SMF, user need to use utility programs developed by IBM or other software vendors for their proprietary software, like DFHSTUP/DFH$MOLS for CICS, else user can use MXG with SAS to generate meaningful reports with pre-defined layouts. For decades, IBM hasn’t allowed SMF data to overflow to distributed platform as readable format until the ZOLDA’s predecessor Z Common Data Provider (ZCDP). With ZOLDA or ZCDP, SMF data are parsed as CSV format and piped off the mainframe platform, I have to acknowledge my admire to the bold move of such intuitive for data democratization. Data as the new fuel for digital era, can be grasped tightly as black hole (only in, no out), or can be shared and consumed without boundary, embracing the open technologies is not an easy but future proven strategy.
I have the privilege to order this product on the day of GA and install the software even before user guide is released, and have gained some first hands experience after couples of weeks’ playing with ZOLDA and ELK for couples. I am going to share my use case in 3 parts:
- Overview of ZOLDA (this article)
- Installation and customisation of ZOLDA and ELK
- [Index and dashboard in ELK with mainframe data]
Overview
ZOLDA based on ZCDP provides data insights for hybrid monitoring and real time incident detection, it streams IBM Z ops data in near real time to one or multiple analytic consumers like ELK, Splunk or data receiver like Kafka, Humio.
Architecture
In general, ZOLDA has 5 STC running in Mainframe, 3 of them are data collector/streamer, and the other 2 are web config tool server.
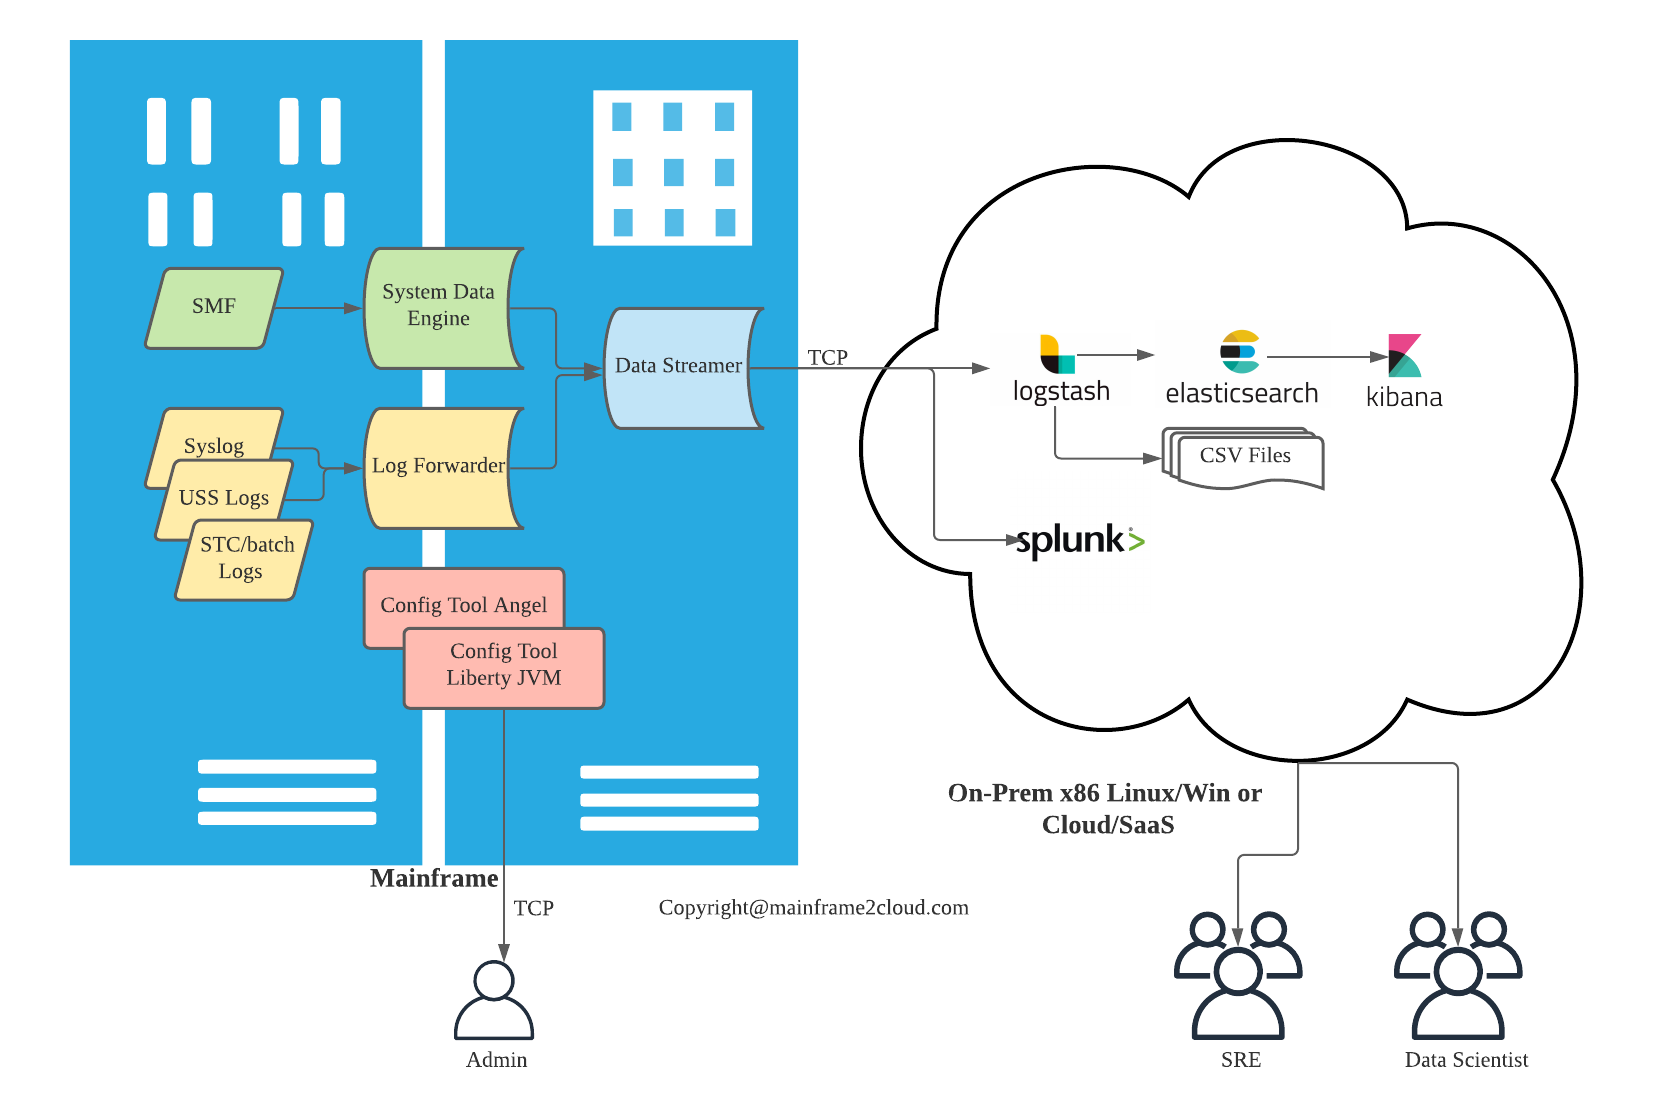
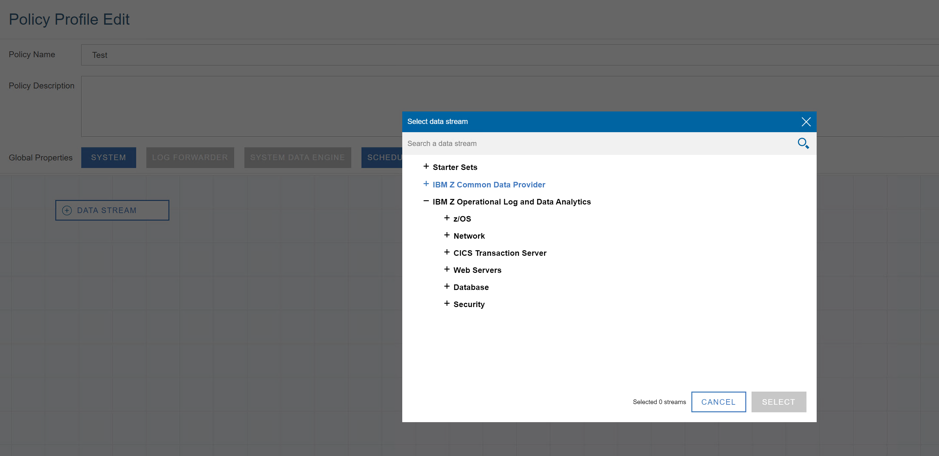
A lightweight setup below shows the SMF data is collected by System Data Engine (SDE), and log data is collected by Log Forwarder(LF), the 2 STC are connected to Data Streamer (DS) via MVS TCPIP, DS has one port exposed to outside Linux or Win server where ELK/Spunk is hosted. To config ZOLDA, it provides a web server based on Liberty JVM, a Liberty angel process is required for authentication, the other STC is the Liberty JVM itself. The web config tool is a GUI tool to define data sources and subscribers. Another port is exposed by config tool for system engineers to access the web GUI using their RACF/ACF2 credentials. So total 2 mainframe TCP ports need to be opened.
The Log Forwarder and System Data Engine send data to Data Streamer via internal TCP, and when DS is not available, no data will be piped. DS can utilise ZIIP to offload GCP cost, thus overall MIPS cost is minimum. Between DS and data subscribers like ELK, if ELK is not available, data is cached within DS JVM memory, cached data size is determined by the heapsize of the JVM server. Cached data can also be stored in local USS file system, when subscriber is up online again, backlog data can be streamed (warm mode) or discarded (cold mode).
Use case
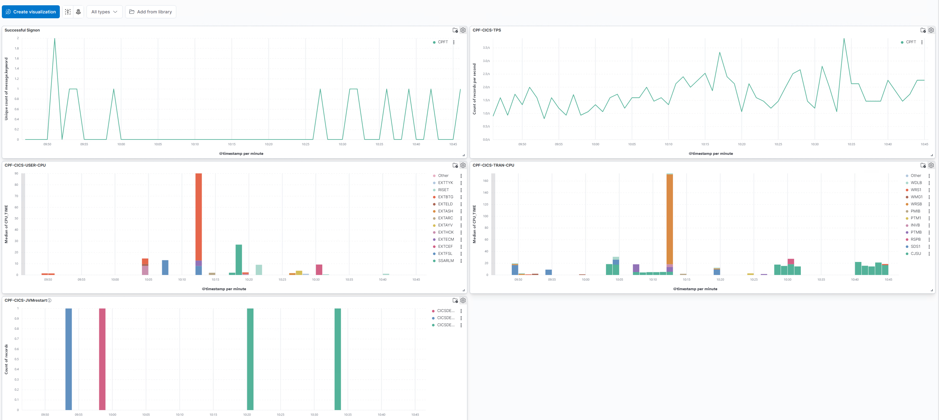
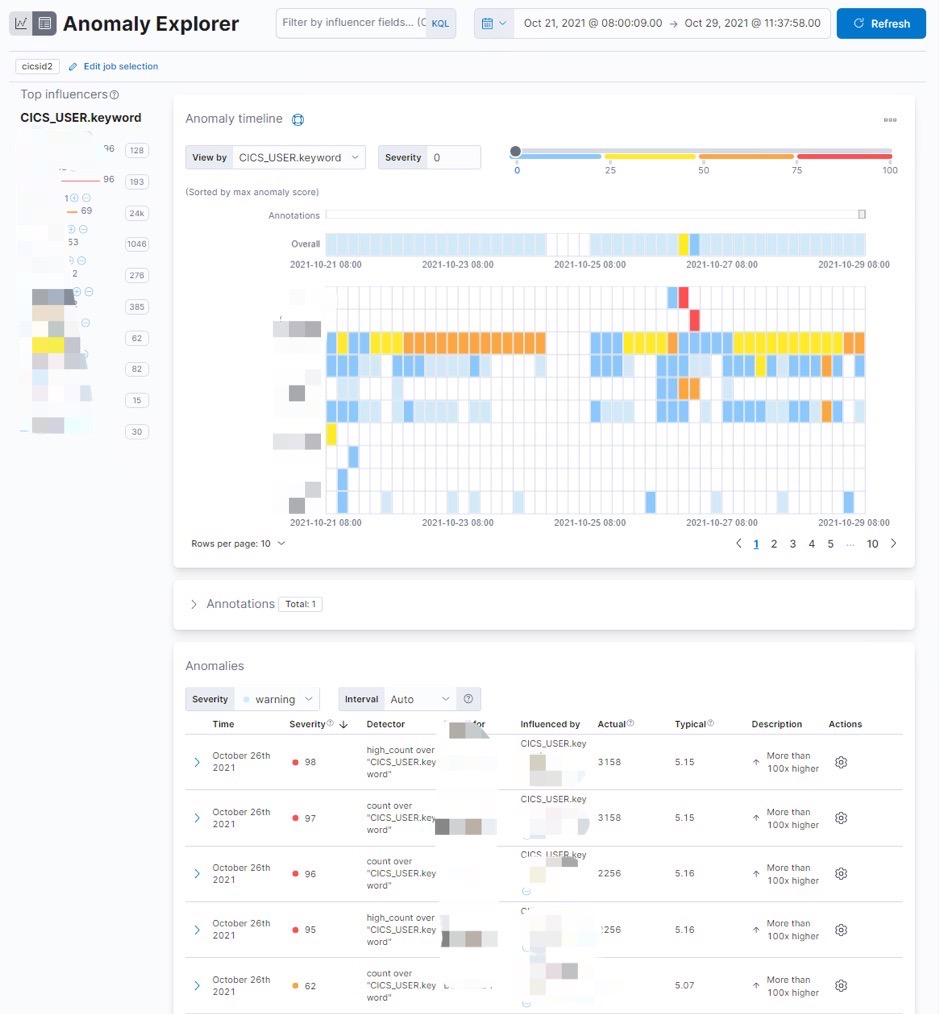
ZOLDA provides few pre-defined dashboards as ELK plugin, Splunk has similar dashboards templates as well. The sample dashboards can show OS, subsystem status and health like number of DB locks, STC CPU usage etc. To better capitalize value of ops data and log, SRE can create dashboards with 600+ metrics (SMF types) and key log messages intuitively in Kibana. Basic supervised Machine Learning framework is also available in Kibana for anomaly detection.
 Popular Cloud Certifications 主流云服务认证一览