Abstract
CICS is celebrating its golden anniversary and its vitality remains in the era of API economy thanks to its ever lasting evolution with new technologies. With more traditional applications being transformed into APIs or services, CICS MIPS cost at service level has become an inevitable question for modern CICS customers. This article explains how to produce MIPS usage report at TPS (transaction per second) level and introduces a new perspective for mainframe OLTP capacity planning.
Background
Born in 8 July 1969, IBM’s Customer Information Control System (CICS) has been dominating business transaction management market for decades. Before CICS celebrates its 50th anniversary in July 2019, it has already added support for RESTful API, Java and Node.JS1. Together with its reliability of running traditional languages like COBOL, PL/I, CICS not only supports 95% of world’s ATM transactions2, it has gained vitality to embrace the API economy and labour force with modern skillset as well.
From 30 billion transactions a day in 20133, to 1.2 million transaction per second in recent days4 — CICS processes mission critical transactions globally for banking, insurance, retail, government and other sectors. Some people may be surprised by the remaining OLTP volume processed by mainframe, many of them may also wonder and ask the same question that IT executives and practitioners would ask: How much does it cost?
In mainframe world, Million Instructions Per Second (MIPS) is the most common used term to measure the capacity of a mainframe hardware or LPAR. Although Million Service Units (MSU) is used in financial contract for mainframe hardware and software, it can be mapped into MIPS for each system z models (PCI in IBM z LSPR profiling5), thus it is logical to use MIPS directly to determine the capacity of one system. In a centralised computing environment like mainframe, one single system can cost millions of dollars. According to AWS: ”For a large mainframe of more than 11,000 MIPS, the average annual cost per installed MIPS is about $1,600.6”
Whether it is expensive or worthwhile to pay such amount money per installed MIPS depends on what you can achieve with the MIPS. It remains a mystery to people who seek the truth: how much MIPS does my application cost? As more mainframe customers migrated their legacy applications to API or web service, transaction per second has become widely used to measure the capacity or throughput of the system, thus there is an increasing demand to discover the CICS MIPS usage at TPS level.
Mainframe system programmers or performance professionals have been trying for years to find an easy way to calculate MIPS usage for a particular application or a magic formula to convert CPU time measured in seconds into MIPS. CPU time in second can be collected and measured easily for batch jobs or one single CICS transaction. But due to the nature of the definition of MIPS: Million Instructions Per Second — there is no sound formula which can directly translate CPU second into MIPS.
A benchmark method is used by IBM to measure the difference of CICS performance caused by varies CICS versions or configurations, its general idea is to capture CICS transaction rate at certain CPU utilisation level. When a given test system with known capacity is full loaded, transaction rate can be monitored and recorded, this TPS can be considered as the max TPS this particular system can support. As benchmarked by IBM with CICS 5.3, “a single IBM z13™ logical partition (LPAR) with 18 central processors (CPs) up to a rate of 174,000 CICS transactions per second.7” The result achieved in the benchmark test tend to prove the high efficiency of CICS 5.3 running the particular testing workload. But for most of mainframe customers, their CICS applications could be much complex and mixed with other workload. In a real production scenario, customers seldom have the luxury to dedicate a system for benchmarking, even if someone can afford the hardware and software resources, they will also face the challenge to simulate their production application runtime environment. What if we can measure the MIPS consumption per TPS in your production system?!
How to calculate MIPS per TPS?
The idea to calculate MIPS usage per TPS simply needs two main sources of data for every reported interval: MIPS and Transaction Per Second. In this calculation, average values of MIPS and TPS of the reported interval are used rather than instant value, because this method is based on statistical analysis, it doesn’t provide real time observation. The reporting interval determines the granularity and amount of data to be processed, 15 minutes can be a good point to being with.
What data need to be collected? And what tools are used? SMF records required: CICS 110 record and RMF 70 record
-
CICS reporting tools: CICS Performance Analyzer or Omegamon CICS EPILOG with SAS or other CICS monitoring tools
-
Scripting and data processing tool: SAS or REXX or others
MIPS usage is calculated from CPU utilisation reported by WLM report.
-
A WLM Report Class should be defined for each CICS region or a group of CICS regions within a CICSPLEX. In this illustration we define Report Class RCCICS01 for CICS1 and RCCICS02 for CICS2. (For a group of CICS region named CICSAORn, Report Class can be defined based on their prefix.)
-
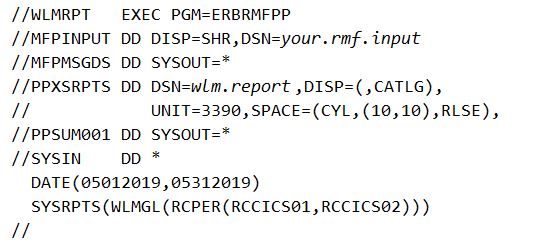
JCL in Figure 1 can be used to generate WLM report for CPU% for each Report Class, with default report interval of 15 minutes.
//WLMCICS  EXEC PGM=ERBRMFPP
//MFPINPUT DD DISP=SHR,DSN=smf
//MFPMSGDS DD SYSOUT=*
//PPXSRPTS DD DSN=output,
//        DISP=(MOD,CATLG),SPACE=(TRK,(500,100)),
//        UNIT=3390,DCB=(RECFM=VBA,LRECL=200,BLKSIZE=27800)
//PPSUM001 DD SYSOUT=*
//SYSIN    DD *
  SYSRPTS(WLMGL(RCPER(RCICS*)))
//
Figure 2 shows the output of above WLM report. The value of ‘TOTAL’ field under ‘TRANS-APPL%—–CP-IIPCP/AAPCP-IIP/AAP’ is the CPU utilisation (of all General CP available to the LPAR) of CICS1 and CICS2. The CPU% includes CPU usage for both CICS system and application.

- The WLM report should be filtered to provide the data fields which are relevant to this study only: Date, Time, General CP CPU% of each Report Class.
General CP CPU% is converted to MIPS for each 15 minutes interval using:
MIPS = CPU of APPL% x Total MIPS / Number of CPU
CPU of APPL% is the total CPU utilisation of all General CP available to the LPAR.
Total MIPS is the assigned MIPS if the LPAR is capped, or total available MIPS of the machine if the LPAR is not capped.
Number of CPU is the number of General CPU assigned to the LPAR.
(If Java workload is processed under CICS with zIIP processor, similar WLM report can be produced based on zIIP CPU utilisation.)
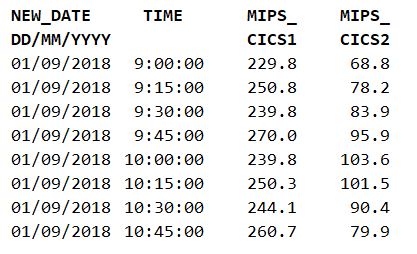
In this illustration, assuming the LPAR is uncapped with a total MIPS of 2000 with 3 General CP assigned, CICS MIPS usage at 09.00.00 interval is:
CICS01: 34.47% x 2000 / 3 = 229.8 MIPS
CICS02: 10.31% x 2000 / 3 = 68.8 MIPS
SAS program in Figure 3 is to filter WLM report and convert CPU% into MIPS for each CICS Report Class for each interval.
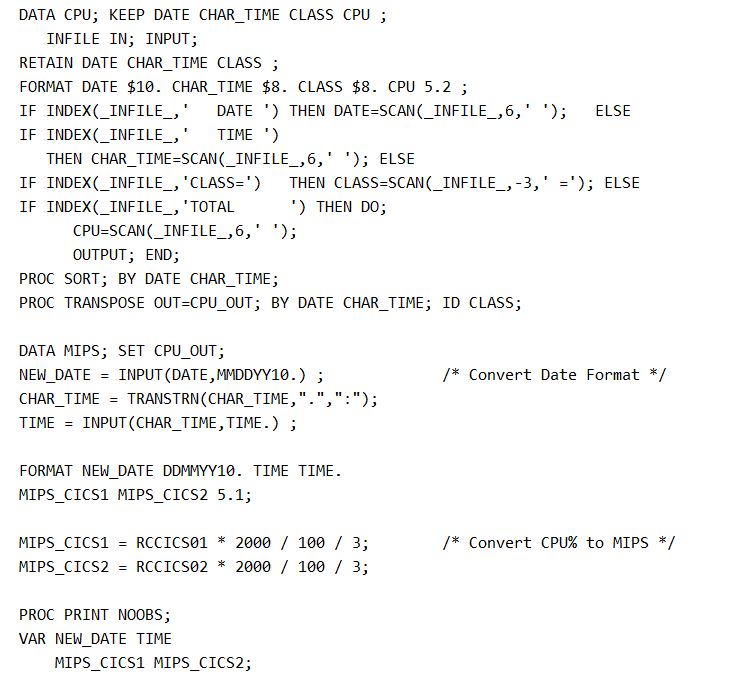
Its output is shown in Figure 4.
Total transaction count for each CICS region or a group of CICS
-
CICS SMF 110 record will be processed and it is recommended to create a subset of CICS SMF 110 record from overall SMF into another daily or weekly file to reduce report processing time.
-
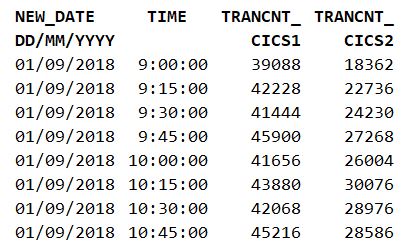
Transaction count per interval can be reported using customised SAS report or other CICS reporting software like CICS Performance Analyzer. A desired transaction count report is shown in Figure 5, which contains both system and application transactions.
- Merge MIPS usage with Total Transaction Count for 15 minutes
Scripting tools like REXX or SAS can be used to merge and format the two datasets, sorted by the unique key of date and time interval. Figure 6 shows the SAS step to merge MIPS report with transaction count report by Date and Time.
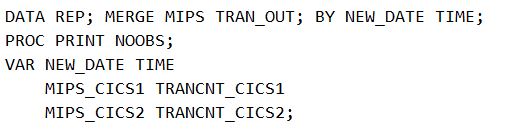
Final report is shown in Figure 7.
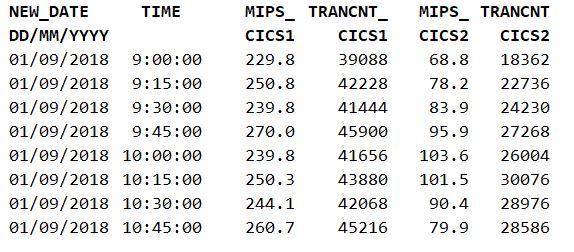
- We can download the final report in text format and import it into Excel or SPSS to create graphic reports for further data analysis and demonstration. TPS can be simply calculate by:
TPS = Transaction Count / 15 mins / 60 secs
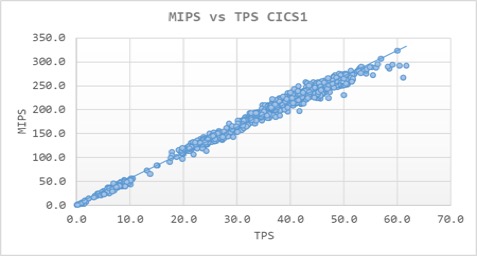
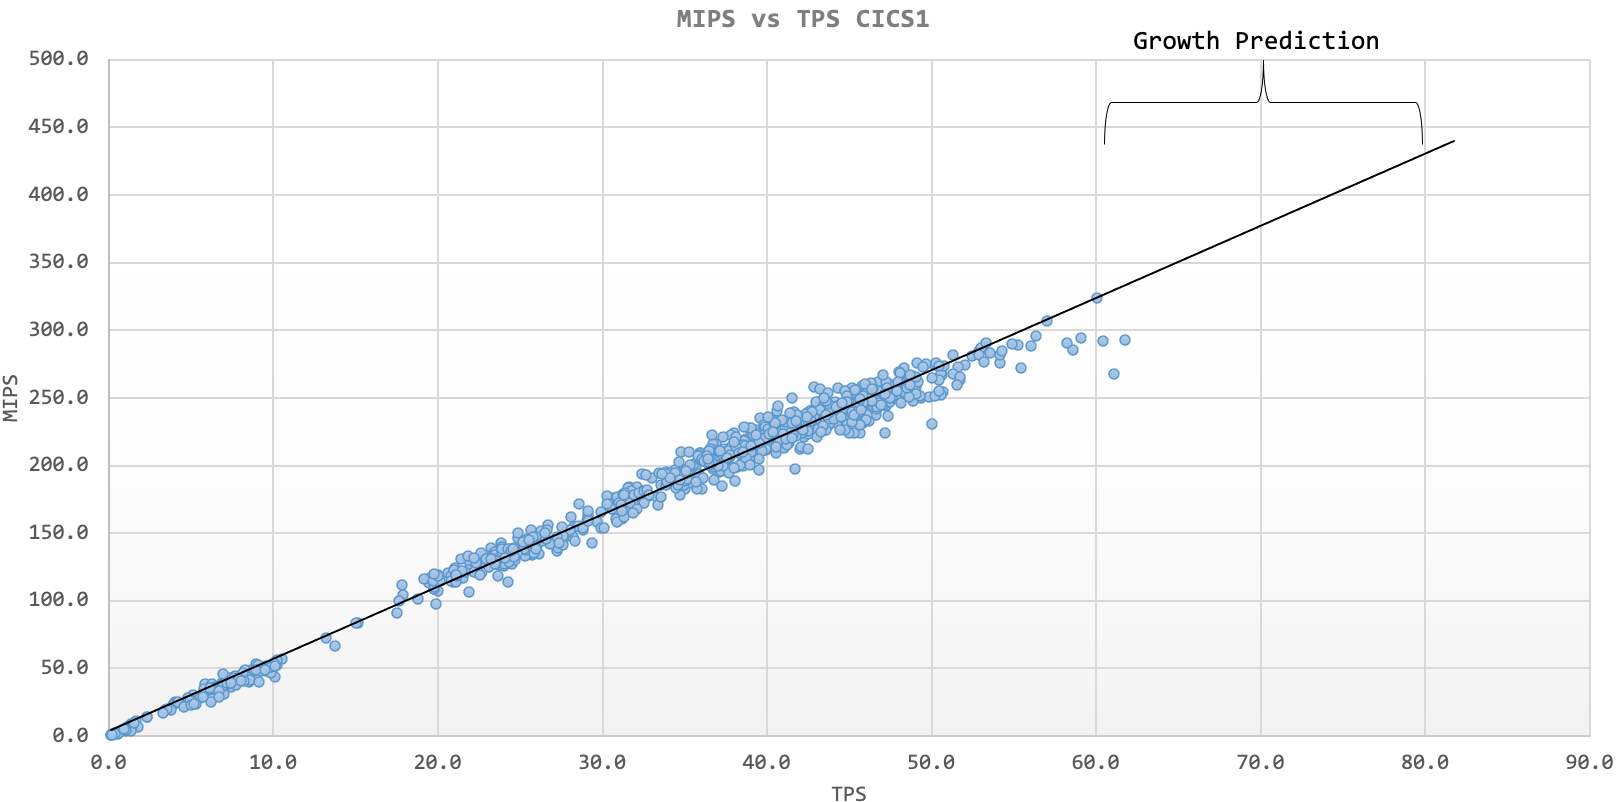
Analyse the MIPS usage vs TPS In Figure 8, scatter chart is created to show the relationship of MIPS usage and TPS, each scatter dot represents the average TPS (x axis) and MIPS usage (y axis) at one certain 15 minutes interval. The trend line shows the linear relationship of two variables, indicating MIPS cost will increase linearly with TPS, which is almost the best workload growth pattern people are willing to have.
Not all types of online workload will follow linear growth in MIPS cost. In Figure 9, workload in another CICS shows an exponential growth of MIPS, which is a more realistic model for production environment.
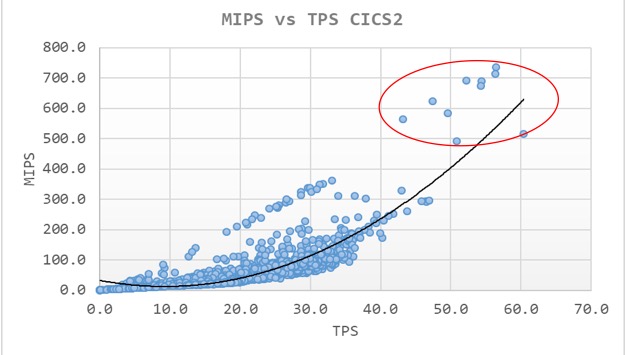
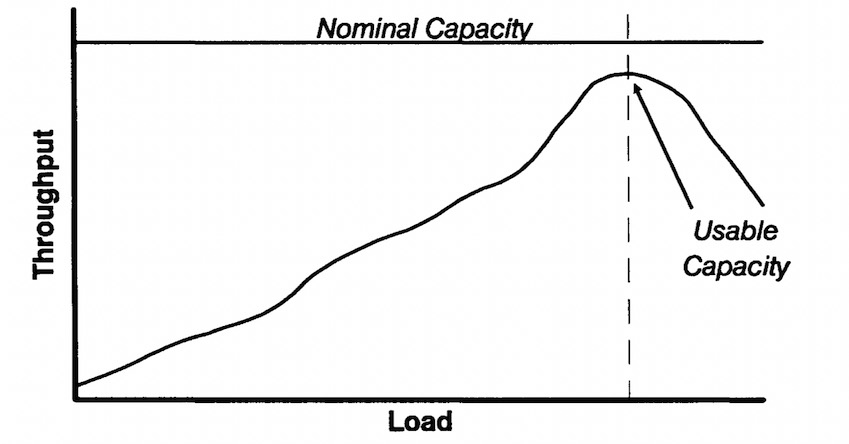
When TPS exceeds 43, outliers begin to appear and make it visible that MIPS usage increases exponentially. This is a clear indicator that the system has reached its bottleneck and it aligns with the performance downgrade expected in nominal capacity as shown in Figure 10. 8
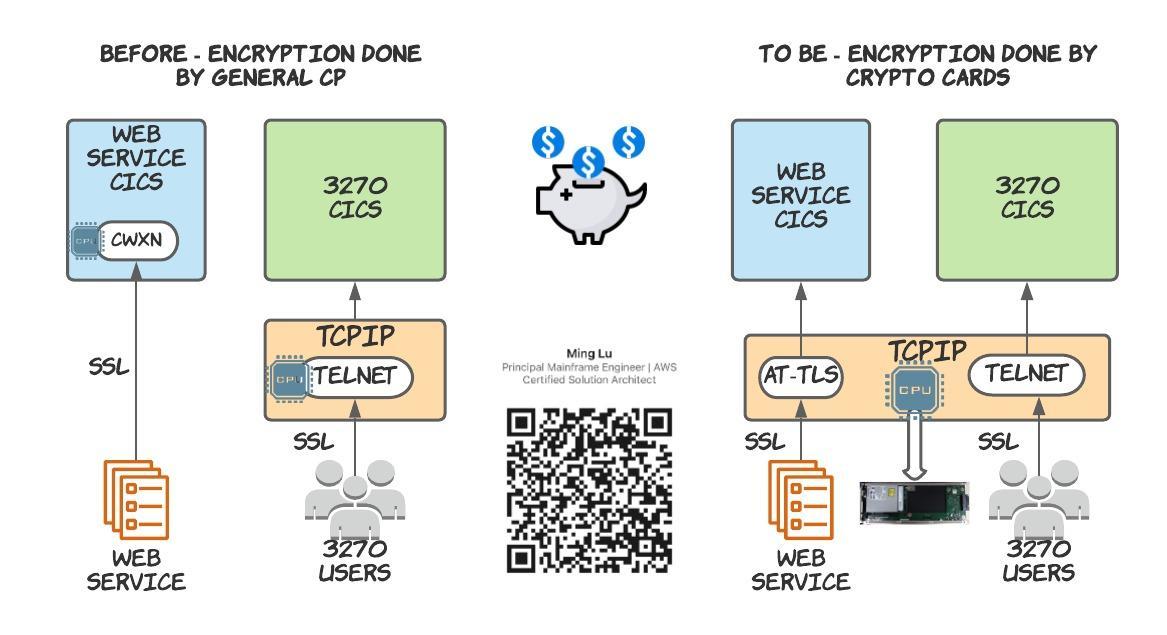
The bottleneck could be caused by many reasons: increase of CPU intensive applications, increase of non-persistent SSL handshake for CICS web service or lack of certain system resources. System programmers or performance analyst could zoom into the bottleneck interval to understand what is the root cause of the performance downgrade .
Capacity Planing using MIPS per TPS
Capacity planning is about what is likely to happen, not what will happen. There are too many details for the planners to consider, many of which cannot be measured or predicted with complete accuracy9. Planners firstly need to study the MIPS usage among different business hours and pay attention to their high watermark to establish a capacity baseline. Planners also need to have a service level or performance goal in mind, so that they can predict future MIPS growth based business and system development plans.
Assuming business plan to grow 10% in every 6 months, or users estimate 10 million new CICS API calls to be expected from next year, planners can translate such new load requirements into TPS. In the linear growth model, if 20 TPS increase is expected, assuming MIPS cost per TPS for new workload is 5, additional MIPS required for 20 TPS will be 100 MIPS as shown in Figure 11. A more comprehensive prediction could study the high and low watermark MIPS usage throughout the day or week, with a pre-set SLA target in mind, planners could create a more precise prediction model.
Conclusion
In Figure 12 we can view capacity planning from 3 perspectives10. User, IT and executive have different focus on capacity, and it is a challenge for the planner to find a model which can fit all their needs. The analytical method using MIPS per TPS is able to address some of concerns of user, IT and executive at the same time.
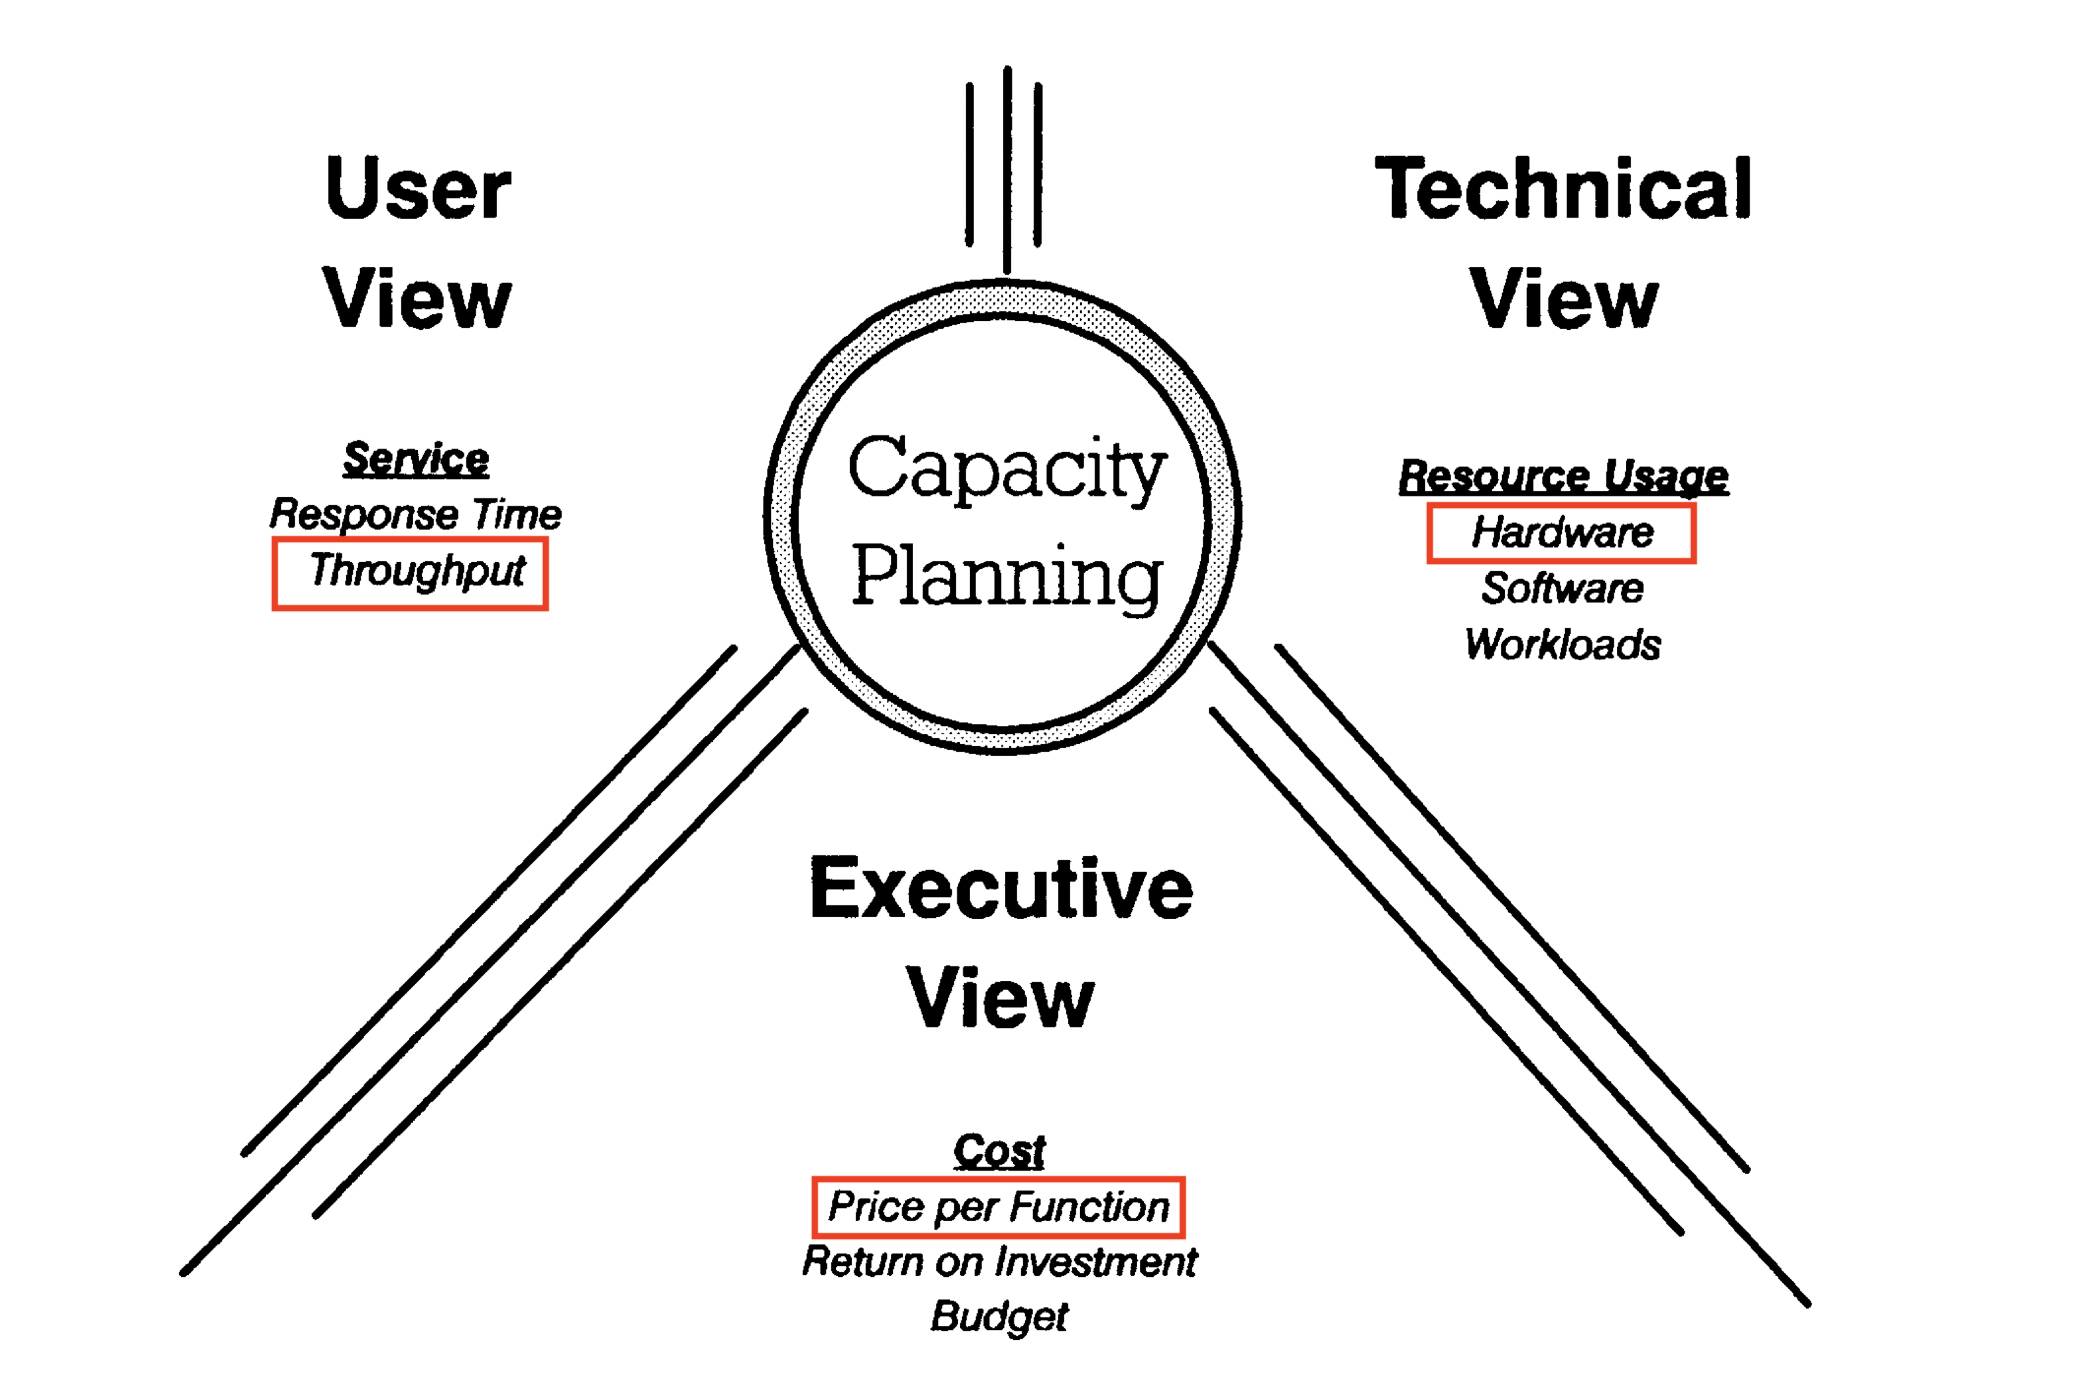
Transaction per second can be interpreted into the throughput of the system for the user. Technical staff who know the total installed MIPS can estimate the room for load growth from current usage. As MIPS cost can be translated to dollars, executive will be able to have an intuitive concept of how much one online application or service costs the company.
In organisation which requires high scalability, from O level executive, to IT architect, DevOPS and infrastructure engineer, each of them plays an essential role to maintain a scalable system. Analysing the MIPS usage per TPS add a new art gene and science branch to the ‘Art and Science’ of capacity planning. The author hopes this method can open up capacity planners a new dimension to capacity study and provide brand new perspective to capacity stakeholders.
Reference:
[1] Node.js Developers: an introduction to Node.js in CICS
[2] REUTERS GRAPHICS - COBOL blues
[3] 5 Things To Know About IBM CICS Transaction Server
| [4] CICS Application Server Software for IBM Z | IBM |
[5] Large Systems Performance Reference for IBM Z
[6] High-Performance Mainframe Workloads on AWS with Cloud-Native Heirloom PaaS
[7] IBM CICS Performance Series: CICS TS V5.3 Benchmark on IBM z13
[8] Capacity Planning for Computer Systems, Chapter 2, P35. Tim Browning, May 10, 2014
[9] Capacity Planning for Computer Systems, Chapter 1, P2. Tim Browning, May 10, 2014
[10] Capacity Planning for Computer Systems, Chapter 3 P58. Tim Browning, May 10, 2014
 如何在2-4周内通过AWS解决方案架构师-助理认证